Doji Candlestick: Definition, Types, and How to Trade It
A doji candlestick forms when open and close prices converge, signalling market indecision, but its trading value
A doji candlestick forms when open and close prices are nearly identical, with the real body no more than 5% of the full candle range, signaling buyer-seller equilibrium. Doji patterns are unreliable reversal signals at short timeframes; daily and 4-hour charts produce stronger signals. Pair dragonfly doji with oversold RSI or gravestone doji with overbought RSI for highest-conviction setups.
- A doji candlestick's real body must be no more than 5% of the full candle range to qualify. Treat this as a ceiling for signal quality, not a target.
- Backtested forex data across 38 million 1-minute candles shows doji patterns are unreliable reversal signals at short timeframes; daily and 4-hour charts produce materially stronger signals.
- Dragonfly doji paired with oversold RSI and gravestone doji paired with overbought RSI are the two highest-conviction doji setups. Single-factor doji signals carry high false-signal risk.
- Stop-loss placement beyond the doji's wick extremes is structurally logical; for prop-firm traders, position size must be calibrated so a stop-out consumes a defined fraction of the daily drawdown limit.
- Three consecutive doji candles (tri-star) signal intensifying indecision and a likely breakout. Direction still requires confirmation from the candle that follows the trio.
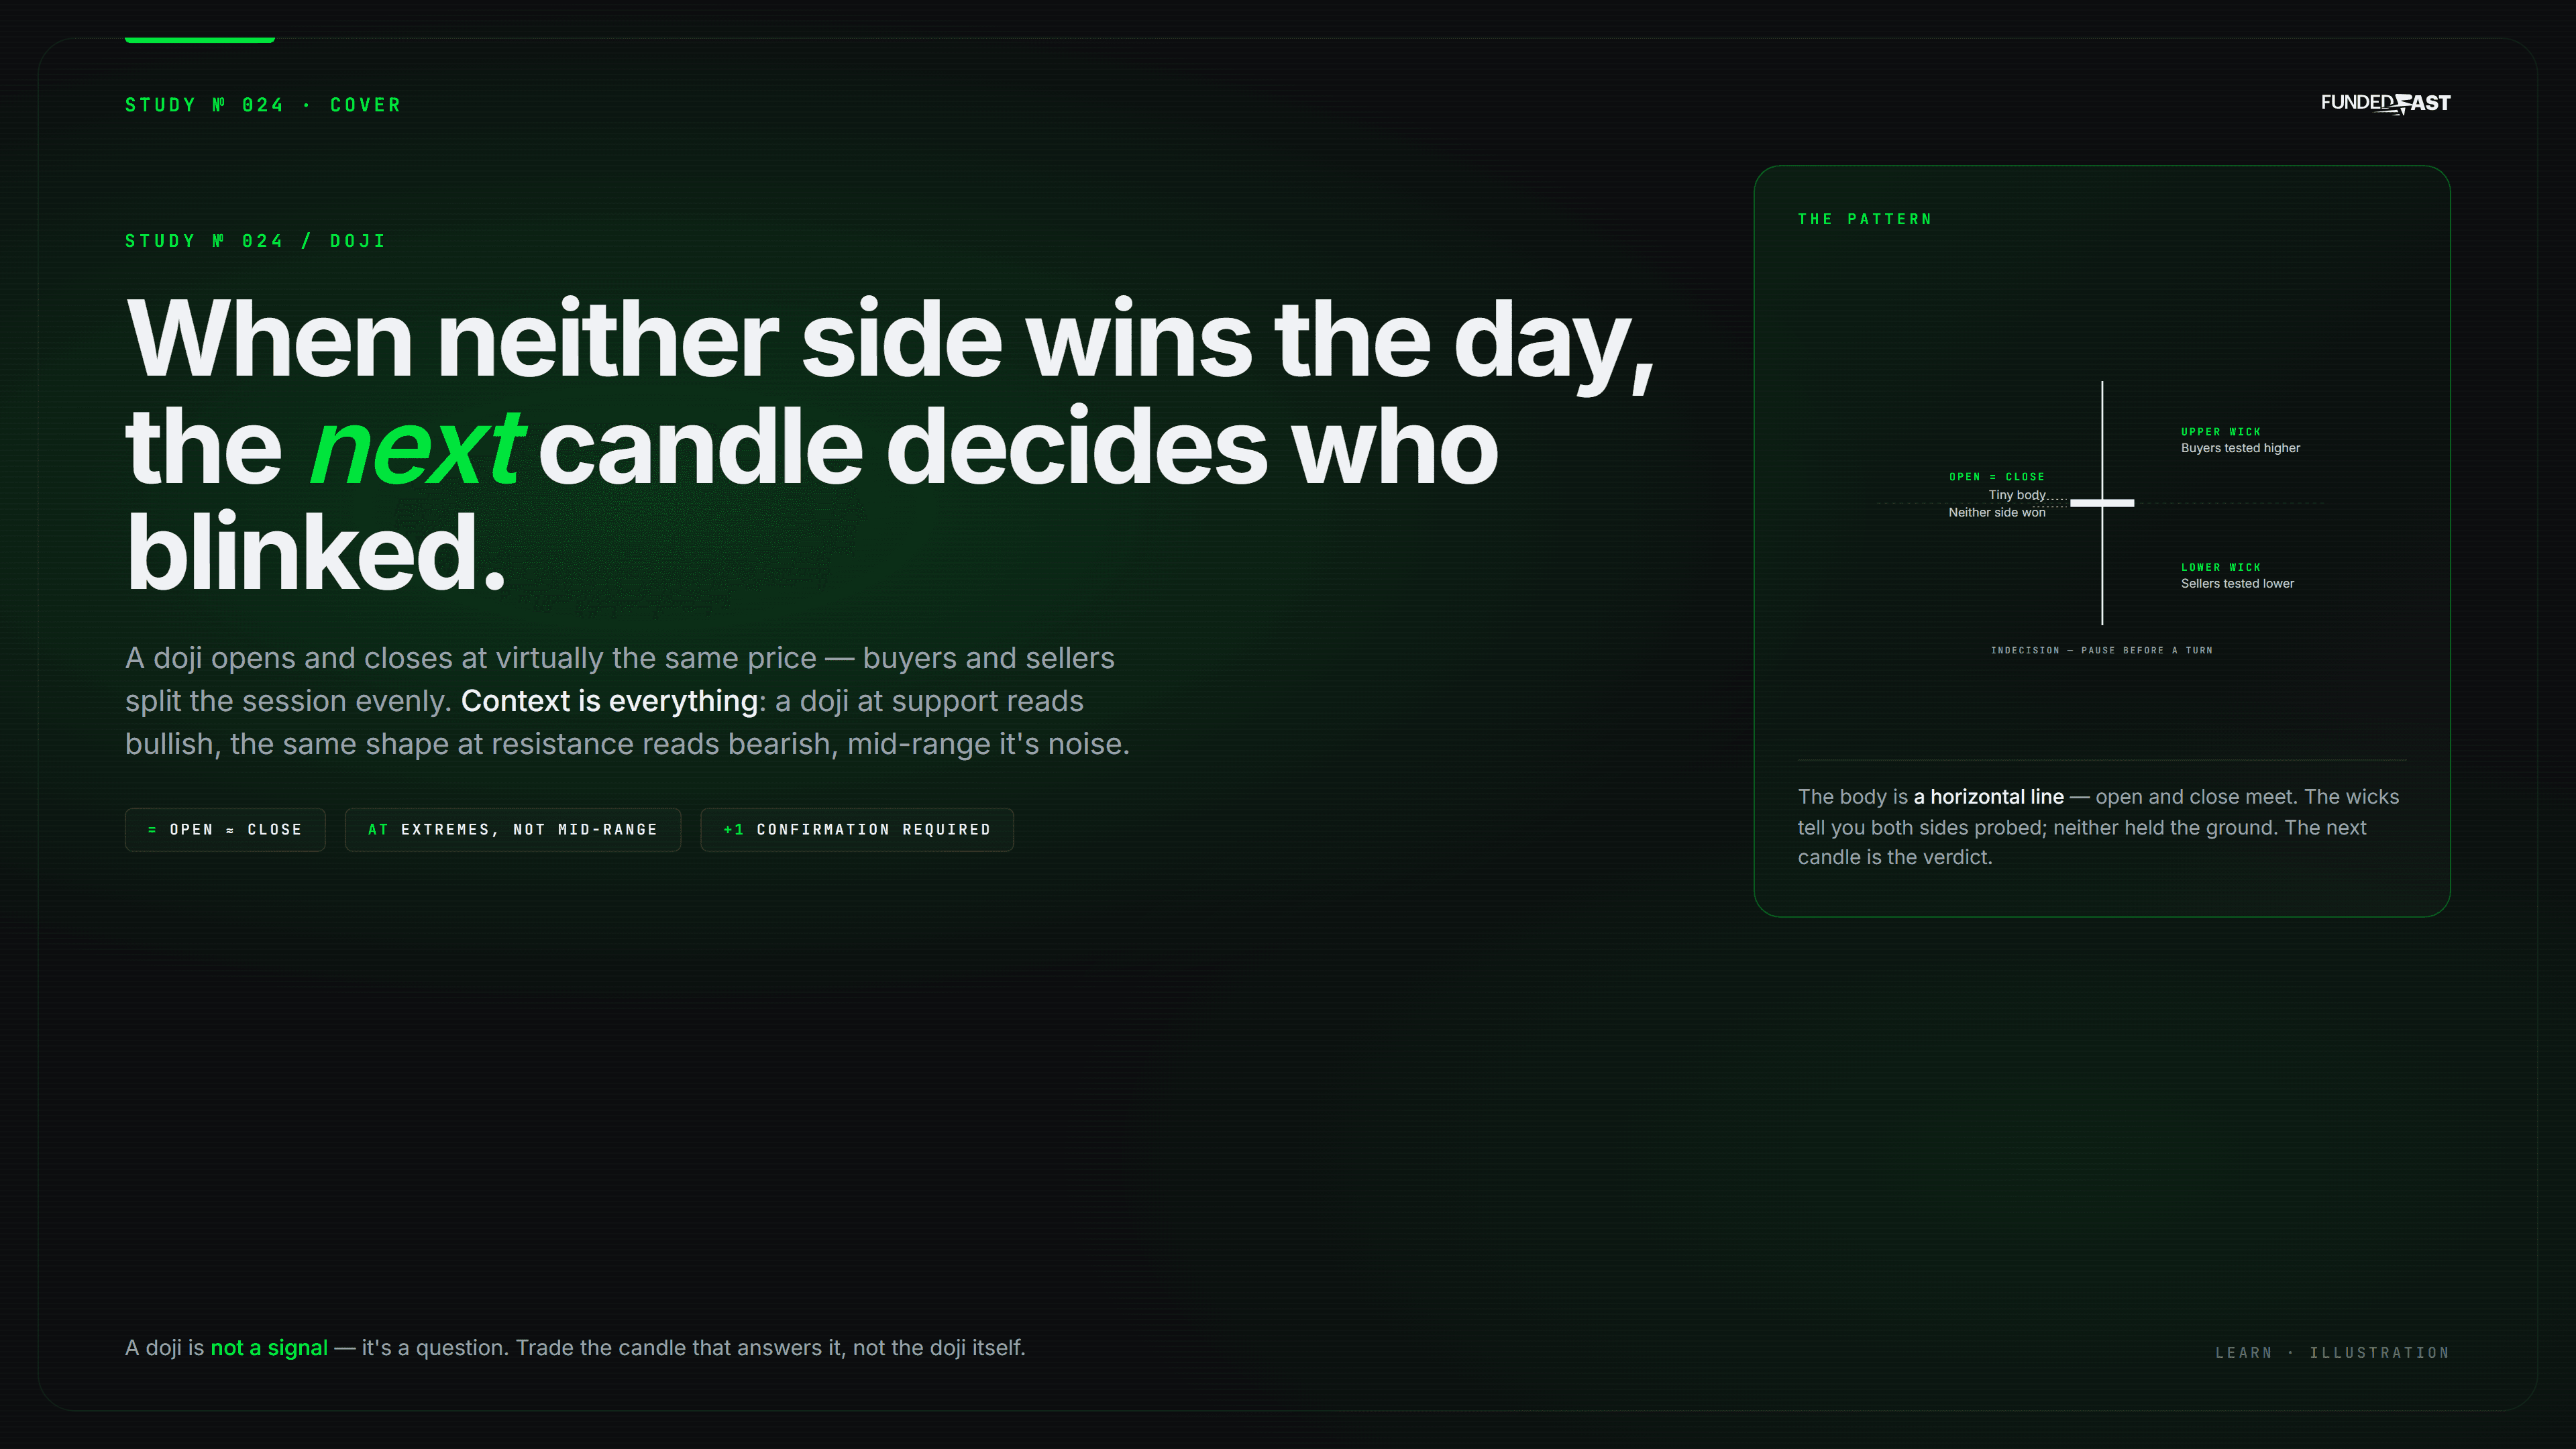
A doji candlestick is a price pattern where the session's opening and closing prices land at or extremely near the same level, producing a candle with a negligible real body and wicks extending in one or both directions. The pattern signals that buyers and sellers reached equilibrium during that session. For prop-firm traders operating under daily drawdown limits, a doji is most useful as a probability filter. A prompt to pause and seek confirmation rather than a standalone entry trigger.
What Is a Doji Candlestick?

The word "doji" (どうじ) comes from Japanese and means "the same thing," according to Investopedia (2026). Candlestick charting itself was developed by Japanese rice trader Munehisa Homma in the 17th century, when he observed that traders' emotions, alongside supply and demand, could move rice prices significantly, per PeerJ Computer Science (PMC), 2025. Steve Nison introduced the method to Western markets in the 1990s (Investopedia, 2026).
Investopedia, 2026: In Japanese, 'doji' (どうじ/同事) means 'the same thing,' referencing the rarity of a security's open and close price being exactly the same.
PeerJ Computer Science (PMC), 2025: The history of Japanese candlestick trading dates back to the 17th century, when rice trader Munehisa Homma discovered that traders' emotions, along with demand and supply, could significantly influence rice prices.
A doji forms mechanically because neither side wins the session outright. Price may travel well above or below the open during the candle's life, but by the close, the market has returned to its starting point. That round-trip is the signal: aggressive moves in both directions were absorbed, leaving the market in balance. For a prop-firm trader, that balance is a warning. The next candle will likely resolve the standoff, and positioning ahead of the resolution without confirmation is a speculative bet against the drawdown rules.
A doji is not a common occurrence in liquid markets. According to Investopedia (2026), a candle's real body must represent no more than 5% of the full candle range to qualify as a doji; anything wider becomes a spinning top. That 5% threshold is the technical boundary, but the practical implication for funded traders is sharper: a doji that just barely qualifies: say, a 4.8% body-to-range ratio. Carries far weaker indecision signal than one with a near-zero body. Treat the 5% rule as a ceiling, not a target.
Three consecutive doji candles: sometimes called a "tri-star" formation, amplify the indecision signal considerably. Three sessions in a row where neither buyers nor sellers can establish a close away from the open suggests that a breakout is building pressure. The direction of that breakout still requires confirmation from the candle that follows the trio, but the pattern raises the probability that a significant move is imminent. The tri-star is covered in more detail alongside the other named variants in the Types section below.
How Do You Identify a Doji Pattern on a Chart?
Identifying a doji candlestick requires three visual checks: the open and close must sit at virtually the same price level, the real body must be negligible relative to the full candle range, and wicks (the thin lines above and below the body, also called shadows) must extend in at least one direction. The wick lengths and their relative proportions determine which specific doji type you are looking at, which in turn shapes the trading implication.
Volume context is the most underweighted identification factor. A doji that forms on above-average volume reflects genuine two-sided combat. Large participants pushed price in both directions and neither prevailed. A doji on thin volume, by contrast, may simply reflect a quiet session where no one was trading with conviction. According to TrendSpider (2024), dragonfly and gravestone doji signals should be treated as weak and ignored unless accompanied by a strong prior trend, above-average volume, and longer-than-average wicks. That three-factor filter applies to all doji types, not just the named variants.
TrendSpider, 2024: Dragonfly and gravestone doji can appear fairly frequently within a chart, but in many cases the signal is not very strong and should be ignored unless accompanied by strong prior trend, above-average volume, and longer-than-average wicks.
Timeframe also affects identification weight. According to LiteFinance, doji patterns are more common on volatile instruments and time frames higher than H1. On a 1-minute or 5-minute chart, a doji can appear dozens of times per session simply because price oscillates around the open in a narrow range. The pattern is structurally common at that resolution and statistically less meaningful. On a daily or weekly chart, a doji is rarer and therefore more informative when it does appear.
Types of Doji Candlestick Patterns
Doji candlesticks come in several variants, each with distinct visual characteristics and different implications for the balance of power between buyers and sellers. Investopedia (2026) identifies 3 major types: gravestone, long-legged, and dragonfly. While MentorMeCareers (2024) extends the taxonomy to 5 types by adding the standard (neutral) doji and the four-price doji. The table below covers the four most tradeable variants. A pragmatic subset that excludes the four-price doji, which is too rare in liquid markets to be actionable, and consolidates the taxonomy into the patterns traders are most likely to encounter. Understanding these variants is essential for traders seeking to applycandlestick patterns to real-world trading as each type carries distinct implications for market structure.
The dragonfly doji forms when the security's high, open, and close prices are the same, with a long lower shadow showing that sellers drove price down aggressively during the session but buyers absorbed every unit of that selling pressure and returned price to the open, per MentorMeCareers (2024). The gravestone doji is the mirror image: buyers pushed price sharply higher during the session, but sellers overwhelmed them and closed price back at the open. The long-legged doji shows both forces at work, large swings in both directions, with neither side achieving a lasting edge.
MentorMeCareers, 2024: The Dragonfly Doji is formed when the security's high, open, and close prices are the same, with a long lower shadow indicating aggressive selling that buyers ultimately absorbed.
The standard doji, a small cross with modest wicks. Is the weakest signal of the four. It indicates indecision but without the dramatic wick extension that marks a genuine battle between buyers and sellers. In practice, standard doji patterns appear frequently in range-bound markets and carry the highest rate of false signals. Prop-firm traders should reserve their attention for dragonfly and gravestone variants at structurally significant price levels, where the wick tells a clear story about absorbed pressure.
A fifth variant worth noting is the tri-star: three consecutive doji candles of any type appearing in sequence. The tri-star is not a single candle but a multi-session formation. Three sessions where neither buyers nor sellers can establish a close away from the open signals that a breakout is building pressure. The tri-star is rarer than the single-candle variants and carries a stronger indecision signal precisely because of that rarity. As with all doji formations, the candle that follows the tri-star provides the directional confirmation required before entering a trade.
Doji Candlestick Reversal: Bullish or Bearish?
A doji candlestick carries no inherent directional bias. The same pattern can precede a bullish reversal, a bearish reversal, or a continuation of the existing trend. The prior trend and the candle that follows the doji are what assign directional meaning. A dragonfly doji appearing at a well-established support level after a sustained downtrend is a bullish reversal candidate; the long lower wick documents that sellers tried and failed to extend the decline. A gravestone doji at resistance after an extended rally is a bearish reversal candidate; the long upper wick shows that buyers ran out of fuel at a price ceiling.
Confirmation from the next candle is not optional. It is the mechanism that converts a doji from an observation into a trade signal. A bullish confirmation candle closes above the doji's high; a bearish confirmation candle closes below the doji's low. Without that confirmation, the doji is simply a record of indecision, not a directive. According to Investopedia (2026), a doji is a neutral indicator; not reliable alone. For prop-firm traders, acting before confirmation means accepting a trade whose direction is unresolved. A poor use of daily drawdown budget.
Investopedia, 2026: A doji is a neutral indicator that provides little information in isolation and is not a common occurrence, making it an unreliable tool for spotting price reversals on its own.
Combining doji type with a momentum oscillator sharpens the signal considerably. According to StockGro (2026), a Dragonfly + oversold RSI = strong bullish; Gravestone + overbought RSI = strong bearish. The oscillator adds a second, independent line of evidence that the trend has exhausted itself, reducing the probability that the doji is a false alarm. This two-factor confirmation approach is more robust than waiting for the next candle alone.
StockGro, 2026: A Gravestone Doji with overbought RSI provides a strong bearish reversal signal, while a Dragonfly Doji with oversold RSI provides a strong bullish reversal signal.
Doji vs. Spinning Top: Key Differences


The distinction between a doji and a spinning top matters most when a trader is deciding how much weight to assign to an indecision signal. Both patterns reflect sessions where neither buyers nor sellers achieved dominance, but the degree of that equilibrium differs in a way that has direct implications for signal strength and stop-loss placement.
The critical difference is not just visual: it is structural. A doji's open and close converge so tightly that the real body is essentially absent, meaning the market returned to its exact starting point. A spinning top has a small but visible real body, meaning one side did achieve a marginal close away from the open. According to Investopedia (2026), a candle body exceeding 5% of the full candle range crosses from doji into spinning-top territory. For a prop-firm trader sizing a stop-loss, this distinction matters: a doji's near-zero body gives a precise anchor for stop placement (just beyond the wick extremes), while a spinning top's small body introduces ambiguity about which price level to defend.
How to Trade a Doji Candlestick Pattern


Trading a doji pattern effectively requires a structured framework rather than a reflexive entry on pattern recognition. The sequence matters: identify the doji type and its location relative to support, resistance, or trend structure; wait for confirmation from the next one or two candles; set stop-loss orders beyond the doji's wick extremes; and define profit targets based on prior swing levels or measured moves. Each step filters out a category of false signal.
Location is the first filter. A doji that forms at a structurally significant price level, a prior swing high, a tested support zone, a key moving average. Carries more weight than one that appears mid-trend with no nearby reference point. The doji formation price action is most actionable when it coincides with a level where other traders are also watching for a reaction. That confluence of attention is what creates the two-sided volume that makes the doji's indecision meaningful.
Stop-loss placement relative to doji wicks is where prop-firm risk management intersects directly with pattern trading. The doji's wick extremes mark the session's full price range. The highest point buyers reached and the lowest point sellers reached. A stop placed just beyond those extremes means the trade is invalidated only if price moves beyond the session's entire range, which is a structurally logical exit. For a funded trader with a daily drawdown limit (the maximum loss permitted in a single trading day before the account is suspended), sizing the position so that a stop-out at the wick extreme consumes no more than a defined fraction of that daily limit is the correct risk framework. Not a fixed percentage of account equity in isolation.
Profit targets should be anchored to prior swing levels rather than arbitrary multiples of the stop distance. A dragonfly doji at support targets the next resistance level above; a gravestone doji at resistance targets the next support level below. This approach produces asymmetric risk-reward setups when the distance to the target is materially larger than the distance to the stop. As of Q2 2025, most systematic doji trading frameworks in the literature use a minimum 1.5:1 reward-to-risk ratio as a filter for taking the trade at all: below that threshold, the pattern's base-rate uncertainty makes the trade mathematically marginal. Traders can validate their risk-reward calculations using a risk-reward calculator to ensure setups meet the minimum threshold before entry.
For traders building algorithmic or semi-systematic approaches, doji detection can be coded as a simple condition: body size divided by total candle range must be below a defined threshold (the 5% boundary from is the standard). That condition is then combined with trend filters (e.g., price above or below a 50-period moving average), volume filters (current volume above the 20-period average), and RSI state (above 70 for gravestone, below 30 for dragonfly) to produce a rules-based entry signal. The advantage of coding the filter explicitly is that it removes discretionary override. A common failure mode when traders see a doji and enter without waiting for confirmation because the setup "looks right."
Doji Pattern Limitations and False Signals
The most important empirical finding on doji reliability comes from a large-scale forex study that analysed 38 million 1-minute historical candles; 13 years of data across 8 currency pairs including EUR/USD, GBP/USD, and USD/JPY. The study found that doji patterns are unreliable indicators of reversals in the forex market at the 1-minute timeframe (ECTI Transactions on Computer and Information Technology, 2025). The same research found that the MIDDAM candlestick pattern. A composite pattern designed to address doji's weaknesses, outperformed traditional doji patterns, recorded as 138 times more profitable; win-to-loss ratio of 6:2. The study's authors attribute this result to MIDDAM's multi-candle confirmation logic, which filters out the single-session noise that makes standalone doji patterns unreliable at short timeframes. That is not an argument against using doji patterns; it is an argument against using them on short timeframes in forex without additional filters.
ECTI Transactions on Computer and Information Technology, 2025: A FOREX market study using 13 years of data and over 38 million 1-minute historical candles found that Doji patterns are unreliable indicators of reversals in the FOREX market at the 1-minute timeframe.
ECTI Transactions on Computer and Information Technology, 2025: The MIDDAM candlestick pattern outperformed traditional Doji patterns in FOREX market simulations, yielding 138 times more profit than Doji patterns with a win-to-loss ratio of 6:2.
Three specific market conditions produce the highest rate of doji false signals. First, low-volume sessions. Particularly the overlap between the New York close and the Tokyo open, or the hour before a major economic release. Generate doji patterns mechanically because price drifts rather than trades. Second, pre-news consolidation periods compress price into a narrow range, producing doji-like candles that resolve violently in either direction once the news hits, with no relationship to the doji's prior trend context. Third, illiquid instruments: thinly traded small-caps, low-float stocks, or obscure altcoins. Can produce doji patterns through a handful of large orders that happen to cancel out, not through genuine two-sided market activity. The practical filter: before acting on any doji, confirm that the instrument's volume during the doji session was at or above its 20-period average.
Doji Candlesticks and Market Context


The reliability of a doji signal is not a fixed property of the pattern. It is a function of the environment in which the pattern appears. A doji at a key support level after a sharp, sustained downtrend in a liquid large-cap stock is a structurally different event from a doji in the middle of a choppy, range-bound session in a thinly traded instrument. The same visual shape carries different informational content depending on market microstructure: in a liquid market, a doji's equilibrium reflects the genuine balance of large, informed participants; in a thin market, it may reflect nothing more than the absence of trading activity.
Timeframe is the second major context variable. As of 2025, the empirical evidence from large-scale backtests consistently shows that doji patterns on daily and 4-hour charts produce more reliable signals than those on intraday charts below H1. The reason is structural: a daily doji represents a full session's worth of price discovery across all participant types: retail, institutional, algorithmic. A 1-minute doji represents sixty seconds of price action, which can be dominated by a single algorithmic order or a brief liquidity gap. For swing traders, the daily chart is the primary doji hunting ground; for day traders, the 4-hour chart provides the minimum timeframe where doji signals carry meaningful weight.
Prop-firm traders face an additional context layer that most retail trading guides ignore: the interaction between doji-based entries and account rule structures. A doji that appears late in a trading session, when a funded trader has already consumed a significant portion of the daily drawdown limit, is a lower-quality setup than the identical pattern appearing at the session open with the full daily budget intact. The pattern's technical merit does not change, but the risk capacity available to exploit it does. Treating doji patterns as probability filters. Tools that raise or lower the likelihood of a directional move. Rather than as entry signals in isolation is the framework that keeps pattern trading compatible with funded account rules. For traders operating under strict drawdown constraints, understanding how hammer and inverted hammer patterns interact with risk management provides additional context for multi-pattern trading systems.
Frequently asked questions
What does a doji candlestick indicate in trading?
A doji candlestick indicates that buyers and sellers reached equilibrium during the session. Neither side could establish a close away from the open. It signals indecision and raises the probability of a directional resolution, but it does not specify direction. The prior trend, the doji's location relative to support or resistance, and the confirmation candle determine whether the signal is actionable.
What is the difference between a dragonfly doji and a gravestone doji?
A dragonfly doji has a long lower wick and no upper wick, forming a T-shape. It signals that sellers drove price down aggressively but buyers absorbed all that pressure and closed price back at the open, a bullish reversal candidate at support. A gravestone doji is the mirror image: a long upper wick, no lower wick, inverted T-shape, signalling failed buying pressure, a bearish reversal candidate at resistance.
How reliable is the doji pattern for predicting price reversals?
Reliability varies significantly by timeframe and asset class. A large-scale forex study analysing over 38 million 1-minute candles across 13 years found doji patterns unreliable at short timeframes. On daily and 4-hour charts in liquid instruments, reliability improves materially. Treat doji as a probability filter that raises reversal likelihood when combined with trend context, above-average volume, and a momentum oscillator, not as a standalone signal.
What should traders do when they see a doji candlestick?
First, identify the doji type and its location relative to support, resistance, or trend structure. Second, check volume, if it is below average, the signal is weak. Third, wait for confirmation from the next candle before entering. Fourth, place a stop-loss beyond the doji's wick extremes. Fifth, size the position so a stop-out consumes a defined fraction of the daily drawdown budget, not a fixed percentage of total equity.
Can a doji pattern appear on any timeframe, and does it matter?
Doji patterns can appear on any timeframe, but timeframe matters enormously for signal quality. On 1-minute and 5-minute charts, doji patterns form frequently due to normal price oscillation and carry high false-signal rates. On daily and 4-hour charts, doji patterns are rarer and represent a full session's worth of genuine two-sided price discovery. LiteFinance (2025) notes doji patterns are more reliable on timeframes above H1.